The C1Olap Toolbar allows you to:
The Open and Save buttons on the toolbar refer to data views – no data is saved, but the custom views of that data are. These data views have the .olapx extension. If you save a data view with the Save button, you can reopen that view of the data at any time using the Open button. The grid display can be exported to a .csv, .txt, or .html file using the Export button. The Grid and Chart menus allow you to customize certain aspects of the OlapGrid and OlapChart. The Report button is used to configure the Grid or Chart you have displayed for printing.
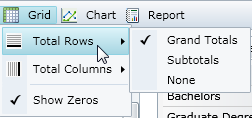
The Grid button is used to choose what totals (if any) you would like to display for the rows and columns within your Grid. The grand total of a row or column can be displayed, as well as be subtotaled. An additional row or column will be added for each subtotal or grand total specified. If the Show Zeros option is selected, any cells that do not contain data will display zeros instead. See Customizing the Look of Your Grid or Chart for details.
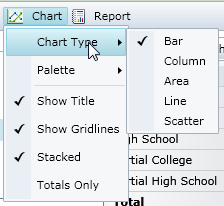
The Chart button is used to configure your Chart options. You can choose the Chart Type and Palette, the display of the Chart Title or Gridlines, and if the Chart is Stacked or displays TotalsOnly. See Customizing the Look of Your Grid or Chart for details.
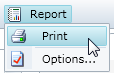
The Report button is used to print the Grid and/or Chart displayed. The Options button will allow you to choose what to print (Chart, Grid, or both), add a header and footer, and set the margins and page scaling. Then choose Print to print your selection. See Printing Your Grid or Chart for details.