You can customize the information displayed in your Grid and Chart, as well as choose the type and color palette of your Chart.
Your grid can be customized using the Grid button on the C1Olap toolbar and the Field Settings dialog box.
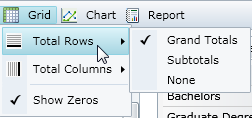
The Grid button on the C1Olap Toolbar is used to choose what totals (if any) you would like to display for the rows and columns within your Grid. The grand total of a row or column can be displayed, as well as be subtotaled. An additional row or column will be added for each subtotal or grand total specified. If the Show Zeros option is selected, any cells that do not contain data will display zeros instead.
The Field Settings dialog box opens when you right-click on a field and choose Field Settings. See Customizing Fields for more information.


You can use the Chart button on the C1Olap Toolbar to customize your chart in several ways. You can specify:
The Type of Chart (five options: Bar, Column, Area, Line, Scatter) See Choosing a Chart Type to view them all.
The Chart Palette (23 options; see Customizing the Look of Your Chart to view them all) Tip: if you can't see all of your options in the menu, right-click in the toolbar and choose Open in New Window or Full Screen to expand your workspace. See Displaying a Web Part in a New Window or Full Screen Mode.
The display of the Chart Title and Gridlines
Whether the Chart should be Stacked or if you want only the Totals displayed. Totals Only will display the aggregate data in the chart as a single number.
Choosing Stacked means that summed data will be displayed in a merged format; turn it off so that each aggregate is displayed separately.
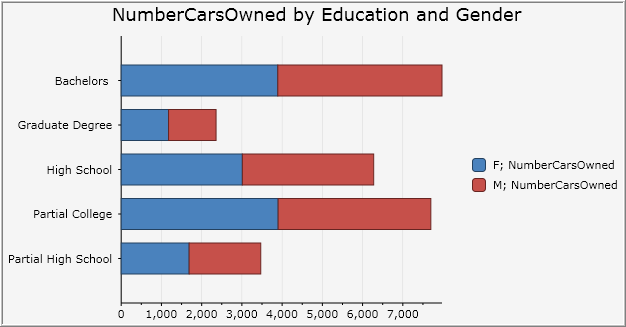
Stacked chart
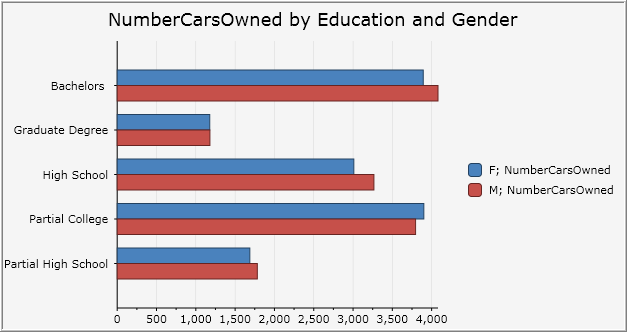
The same chart not stacked