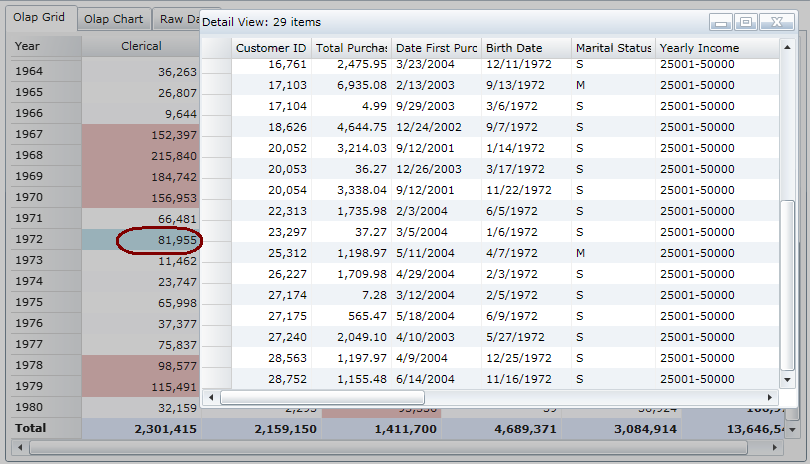
Each cell in a C1Olap grid can represent many records in the data source. You can view the records behind each cell by double-clicking it.
For example, this Grid displays the total dollar amount of purchases in a specific year by men, broken down by occupation. Double-clicking on the cell containing 81,955 displays the detailed data behind that number — who made the purchases, the amount, their birth date, marital status, etc.
