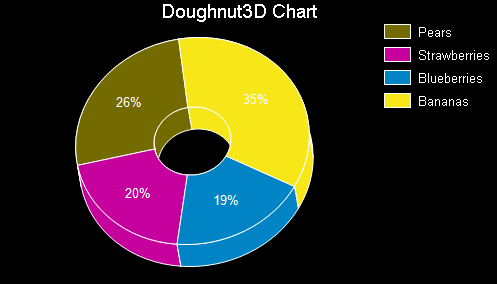
A 3D doughnut chart shows how the percentage of each data item contributes to a total percentage, allowing the data to be viewed in a 3D format.

Note: To see a chart in three dimensions, the ProjectionType must be Orthogonal. The ProjectionType is found in the ChartArea Collection dialog in the Projection section.
|
Chart Information | |
|---|---|
| # of Y values/data point | 1 |
| # of Series | 1 |
| Marker Support | Series or Data Point |
| Custom Properties | ExplodeFactor gets or sets the amount of separation between data point values. The value must be less than or equal to 1. To explode one section of the doughnut chart, set ExplodeFactor on the data point instead of on the series. HoleSize gets or sets the inner radius of the chart. If set to 0, the chart will look like a pie chart. The value must be less than or equal to 1. OutsideLabels gets or sets a value indicating whether the data point labels appear outside of the graph. StartAngle gets or sets the horizontal start angle for the series data points. |
Below is an example of setting the custom chart properties at run time for a 3D doughnut chart as shown in the image above.
' Visual Basic
Me.ChartControl1.Series(0).Properties("ExplodeFactor") = 0.0F
Me.ChartControl1.Series(0).Properties("HoleSize") = 0.33F
Me.ChartControl1.Series(0).Properties("OutsideLabels") = False
Me.ChartControl1.Series(0).Properties("StartAngle") = 50.0F

// C#
this.ChartControl1.Series[0].Properties["ExplodeFactor"] = 0f;
this.ChartControl1.Series[0].Properties["HoleSize"] = .33f;
this.ChartControl1.Series[0].Properties["OutsideLabels"] = false;
this.ChartControl1.Series[0].Properties["StartAngle"] = 50f;
Copyright © 2004-2005 Data Dynamics, Ltd. All rights reserved.