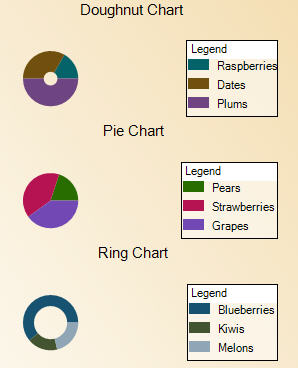
A doughnut chart shows how the percentage of each data item contributes to the total.
|
Chart Information | |
|---|---|
| # of Y values/data point | 1 |
| # of Series | 1 |
| Marker Support | Series or Data Point |
| Custom Properties | ExplodeFactor gets or sets the amount of separation between data point values. HoleSize gets or sets the inner radius of the chart. OutsideLabels gets or sets a value indicating whether the data point labels appear outside the chart. StartAngle gets or sets the horizontal start angle for the series. |
In order to show each section of the pie in a different color, the Background property for each data point must be set. Below is an example of setting custom chart properties at run time for a doughnut chart.
' Visual Basic
Me.ChartControl1.Series(0).Properties("ExplodeFactor") = 0.0F
Me.ChartControl1.Series(0).Properties("HoleSize") = 0.25F
Me.ChartControl1.Series(0).Properties("OutsideLabels") = False
Me.ChartControl1.Series(0).Properties("StartAngle") = 0.0F

// C#
this.ChartControl1.Series[0].Properties["ExplodeFactor"] = 0f;
this.ChartControl1.Series[0].Properties["HoleSize"] = 0.25f;
this.ChartControl1.Series[0].Properties["OutsideLabels"] = false;
this.ChartControl1.Series[0].Properties["StartAngle"] = 0f;
Copyright © 2004-2005 Data Dynamics, Ltd. All rights reserved.