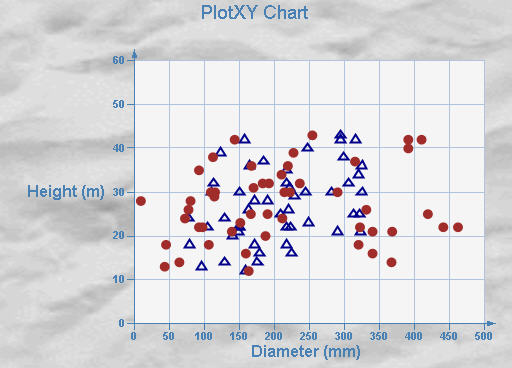
A plot XY chart shows the relationships between numeric values in two or more series sets of XY values.
|
Chart Information | |
|---|---|
| # of Y values/data point | 1 |
| # of Series | 1 or more |
| Marker Support | Series or Data Point |
| Custom Properties | None |
Copyright © 2004-2005 Data Dynamics, Ltd. All rights reserved.