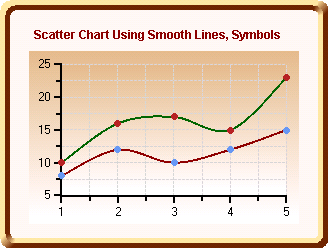
The chart below demonstrates a Scatter chart using smooth lines and symbols.

To create a basic Scatter chart using smooth lines and symbols, use the same property settings as the X-Y Axis Scatter Chart Using Smooth Lines. In addition, data displays using symbols to represent certain points on the chart.
Send comments about this topic to ComponentOne. Copyright © ComponentOne LLC. All rights reserved. |