To configure the data bound WebChart using the Chart Properties editor, complete the following steps:
1. Add a C1WebChart control to the Web form and bind it to a datasource control, see Binding C1WebChart to a Data Source Control.
Use Products Above Average Price table, retrieve ProductName and UnitPrice fields.
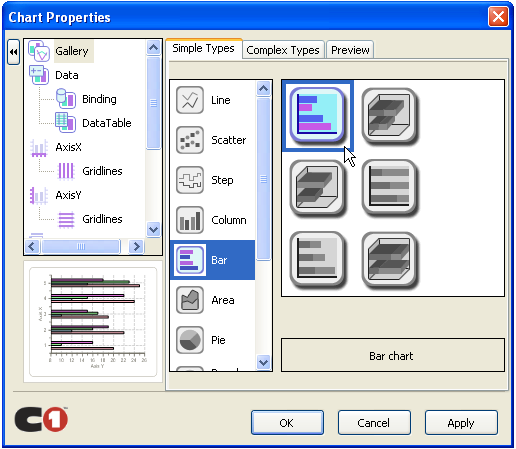
2. Right-click on the C1WebChart control and select Chart Properties from its context menu. The Chart Properties designer appears.
3. Select Gallery in the treeview, Bar type in the Simple Types, and the first bar chart in the subtype (simple bar chart). Click Apply. C1WebChart now has horizontal bars, with the X-axis on the left and the Y-axis on the bottom.
4. Select Data in the treeview, select series 0 from the Data Series list box, and then for the Data binding select Product Name from the X drop-down list box and UnitPrice from the Y drop-down list box.
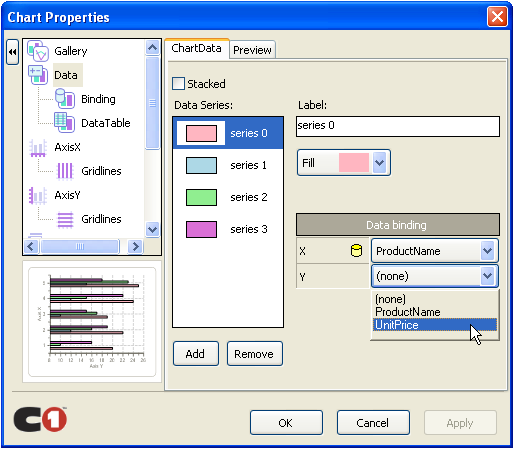
5. In the Data Series list box remove series 1, series 2, and series 3 by clicking on the Remove button for each one. Click Apply and then click OK.
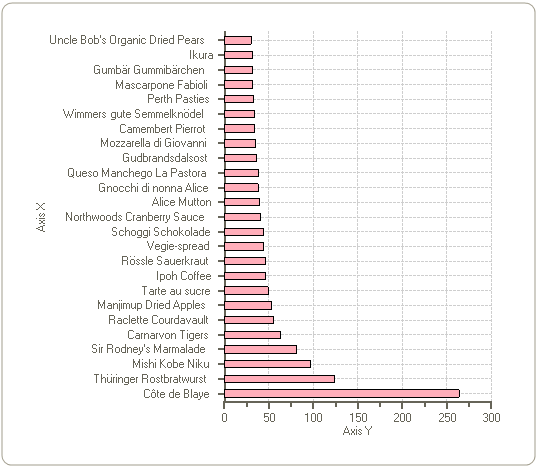
6. Resize C1WebChart to 500 px wide by 350 px high, then press F5 or click on the Start Debugging button to run the Web application
C1WebChart appears like the following at run time:
Send comments about this topic to ComponentOne. Copyright © ComponentOne LLC. All rights reserved. |