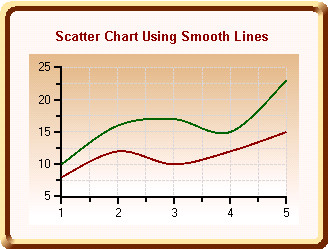
The chart below demonstrates a Scatter chart using smooth lines.
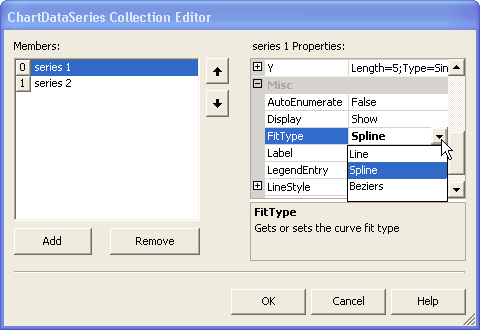
To create a basic Scatter chart using smooth lines, use the same property settings as the standard line chart. For more information on these properties, see X-Y Axis Line Chart. For each series, set the FitType property from the ChartDataSeries class to Spline. You can also specify this in the ChartDataSeries Collection Editor. See the following image for an example:
Send comments about this topic to ComponentOne. Copyright © ComponentOne LLC. All rights reserved. |