Creating Subtotals
The Subtotal method adds subtotal rows that contain aggregate data for the regular (data) rows.
Subtotal supports hierarchical aggregates. For example, you may call it several times in a row using different parameters to get sales figures by Product, Region, and Salesperson. You may also calculate aggregates other than sums (for example, averages or percentages) and format the subtotal rows to highlight them.
For example, assuming you had a VSFlexGrid control named fg containing Product, Region, Salesperson, and Sales information, you could summarize it with the following code:
' clear existing subtotals
fg.Subtotal flexSTClear
' get an Grand total (use 1 instead of columns index)
fg.Subtotal flexSTSum, -1, 3, , 1, vbWhite, True
' total per Product (column 0)
fg.Subtotal flexSTSum, 0, 3, , vbRed, vbWhite, True
' total per Region (column 1)
fg.Subtotal flexSTSum, 1, 3, , vbBlue, vbWhite, True
' show an OutlineBar on column 0
fg.OutlineBar = flexOutlineBarSimple
After executing this code, the grid would look like this:
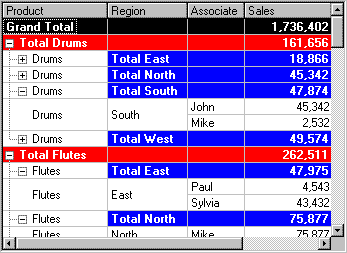
The subtotal rows created by the Subtotal method differ from regular rows in three aspects:
1. Subtotal rows can be automatically removed by invoking the Subtotal method with the flexSTClear parameter. This is useful to provide dynamic views of the data, where the user may move columns and re-sort the data, making it necessary to recalculate the subtotals.
2. Subtotal rows can be used as nodes in an outline, allowing you to collapse and expand groups of rows to present an overview of the data or to reveal its details. To see the outline tree, you need to set the OutlineBar property to a non-zero value. Because the outline is a hierarchical structure, each row has a level that defines how deep into the outline the node is. This level can be set or retrieved through the RowOutlineLevel() property.
3. When the grid is bound to a data source, the subtotal rows do not correspond to actual data. Thus, if you navigate the recordset using the MoveFirst and MoveNext methods, the subtotal rows will be skipped.
The picture above shows the subtotals and the outline tree next to the data on the first column. The outline tree allows users to collapse and expand sections of the grid by clicking on the nodes, and can be very useful to display other types of data, not only aggregates.