
The C1Olap Data Panel is where you select and configure the data you would like to examine. The Data Panel is easy to use, but you need to know what question you are trying to answer (For example, how many children do women with graduate degrees have?) to make the correct choices. (See Analyzing Data with C1Olap.) Of course, it is harmless to experiment with different data configurations; just save any views you find valuable as you work using the Save button on the C1Olap Toolbar.
Note: It is best to work with the Defer Updates check box selected. That way, the data will not recalculate until you clear the check box. If you have a large data set, this will save time.
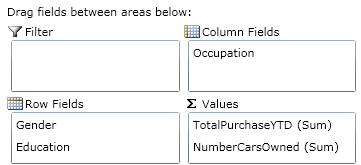
The top area of the Data Panel is where you choose the data you want to examine. Select the fields you need and move the field to one of the areas below (Filter, Column, Row, or Values) using drag-and-drop. You can also right-click on the field to display a Move menu you can use instead.


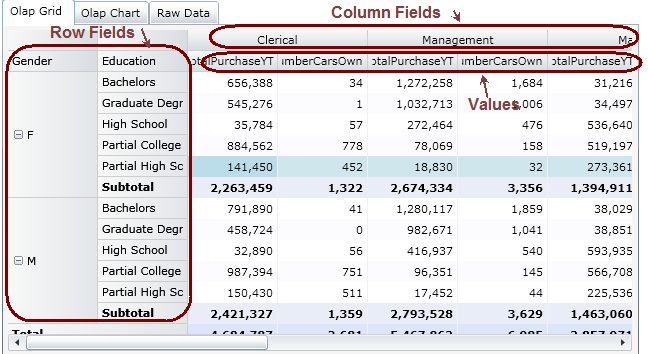
The bottom area of the Data Panel is where you configure the data you have selected. Once data fields are dropped in these areas, a resulting report will appear in the Grid and Chart Windows.
Each field can be customized further by right-clicking on it and choosing Field Settings from the menu. See Customizing Fields for details.