
It is easy to spot trends in small data sets — 10, 20, or even 50 records for example. But most databases contain thousands of records, so while you are rich in data, you can be poor in understandable, actionable information.
C1Olap allows you to dynamically analyze your data, view it in a chart and grid, save a snapshot of that view, and print it.

When analyzing data, the very first step is: Determine what want to learn from your data. The simplest way to do this is to make a list of questions. This is where OLAP comes in, because it makes it possible to combine these questions into a single view that may answer everything at once.
After you know the questions, you can find the answer in C1Olap.
In order to get the view of your data that you need, you need to move data fields into the proper spot of the C1Olap Data Panel. You can plan this out ahead of time, or try different scenarios on-the-fly. Working without a plan can’t hurt, because you are spending minutes of trial and error, not hours of coding.
When analyzing your data, keep in mind what the four sections of the C1Olap Data Panel are used for.

You can move your fields in C1Olap using drag-and-drop and right-click menus, see C1OLAP Data Panel for details.
If you would like to narrow down your entire data set universally do it here. You can set filters in the other areas, but if you only want to look at a specific group of people, this is the place to do it. You can set one filter, or combine them. Some options:
The fields you add here become the row headers of the grid. These are the categories on the left of the grid. On the chart, they will often be the Y-axis.
These fields in this area become the column headers of the grid. These are the categories at the top of the grid. On the chart, they will often be part of the Legend.
Only numeric fields go here. The aggregate for this field (or fields) will be displayed in the grid and chart.
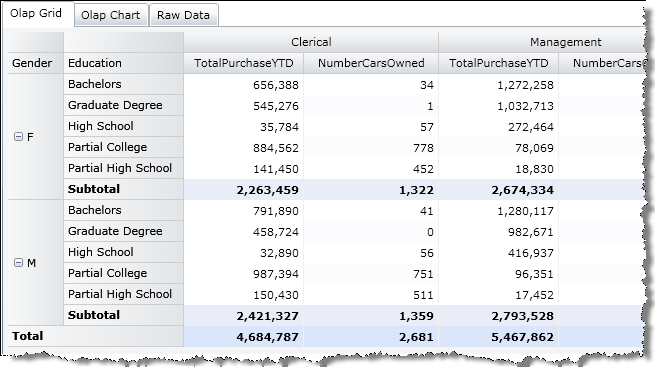
The fields in the C1Olap Data Panel pictured above are from a database containing demographic information about thousands of customers. Here is what your default grid would look like if you dropped those fields into the C1Olap Data Panel exactly as above. As you can see, Gender and Education became the rows, Occupation became the columns, and the Total Purchased to Date ($ spent) and the Number of Cars Owned are calculated for each of those categories.
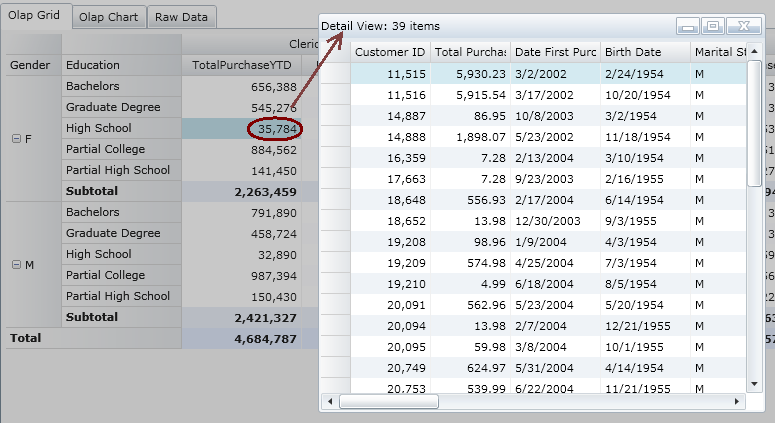
To drill-down on any of the numbers, just double-click on any cell. You can then see exactly how that number was calculated. The database contains records for 39 female customers with high school degrees. All the detail about them in the database (birthday, marital status, etc.) is available.
Now that you have your basic grid and chart (when you create the grid, the chart is created simultaneously), you can:
Customize them — you can change the field names, highlight data, filter data, set the chart type and palette. See Customizing Fields and Customizing the Look of Your Grid or Chart.
Save them — see Saving Your Grid and Chart.
Print them — see Printing Your Grid or Chart.
Export the data — click the Export button
 in the toolbar to export to .csv, .txt.
or .html.
in the toolbar to export to .csv, .txt.
or .html.
See C1Olap Quick Start for an example you can work through that demonstrates many of C1Olap’s options.