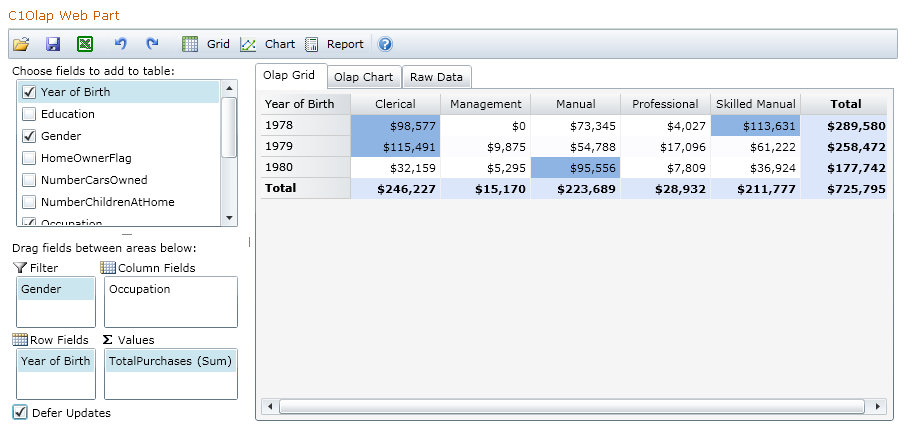
The C1Olap Web Part Quick Start shows you how to create an OLAP Grid and Chart from demographic data stored in a SharePoint list.

This Quick Start uses the Demographics list. If you have not created this list, see Quick Start for instructions.
How it works:
The Demographics list contains detailed data about 1,700 individuals: their birth date, yearly income, marital status, gender, how much they spent, number of children, highest level of education, occupation, number of cars they own, and whether or not they own a home. This data can be examined a number of ways in the C1Olap Web Part to learn about the earning, spending, and lifestyle choices of this group.
To create a custom view of data with C1Olap
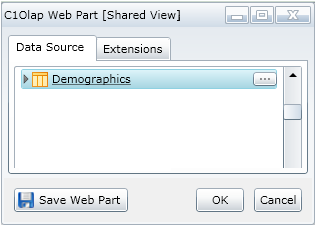
Now we will customize the appropriate fields in the C1Olap Data Panel. (See the Tour of C1OLAP for more about the Data Panel.)
Note: Make sure the Defer Updates check box in the lower left of the Web Part is selected before starting. This will prevent the data from being recalculated every time we make a change to a field.
Customizing the Gender filter
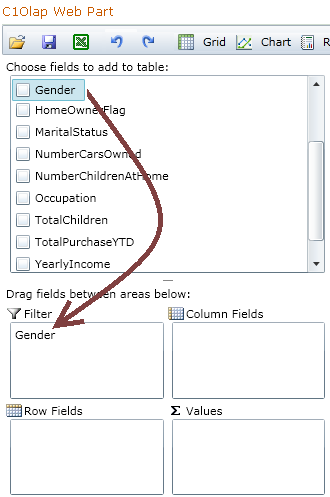
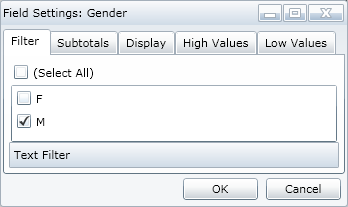
First, click on the Gender field, then drag the field to the Filter area.
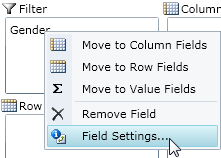
Right-click on Gender, and choose Field Settings from the menu.
Customizing the Spending Amounts
The field TotalPurchase contains the total amount spent by each of the men on our product. We'd like it to display as dollar amount in the Grid, we'd also like values above $80,000 to have blue shading in the Grid.
Select the TotalPurchase check box; since it is a numeric field it will automatically be added to the Values area. (Of course, we can drag fields to any area.)
In the Format tab, click Currency on the left.
In the High Values tab, enter 80000 in the Apply to Values Above text box. Change the Not Set drop-down to Absolute. From the Background drop-down, choose a blue shade from the color picker. Click OK.
Setting Up the BirthDate field to display the Spending Data by Year of Birth
We have the Birth Dates for all of the men, and we'd like use that information to aggregate our data — instead of the rows being the birthday of each man in the database, we'd like to see the spending data for each year of birth, starting with 1978. Then we can see how someone's year of birth may affect their spending habits.
Right-click on BirthDate, and choose Field Settings from the menu.
In the Filter tab, click the Date/Time Filter button and set it to Greater Than 12/31/1977 12:00:00 AM. Click OK.
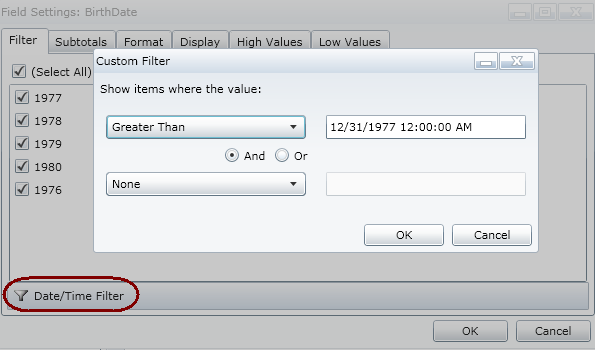
In the Display tab, change the Caption from BirthDate to Year of Birth. This will change the display name of the field in the C1Olap Data Panel, as well as the title displayed on the row in the Grid.
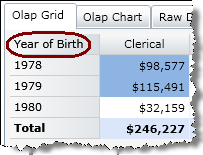
Click OK. You may want to clear the Defer Updates check box and take a look at what we've done so far. You'll see that specifying Row and Value fields is sufficient; you don't have to specify Column fields unless you need them. Select the Defer Updates check box when you are done.
Displaying the Spending Data by Occupation
Since we would like the spending information to appear in columns, segmented by occupation, we use the Occupation data for our columns.
We want the information for all the occupational levels to display, so that's it.
Setting the Grid Totals
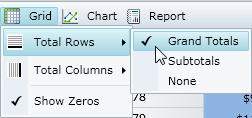
In this Quick Start, we'd like each row to display a Grand Total, and we'd also like each column to have one. This is easy to customize using the Grid button in the C1Olap Toolbar. You can also choose to display a Subtotal, or no total at all.
Customizing the Chart
Now we need to choose our chart type and palette. These are changed using the Chart button on the C1Olap toolbar.
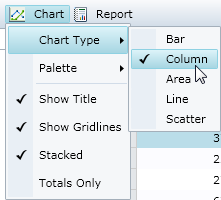
Now clear the Defer Updates check box, and see what you've created.
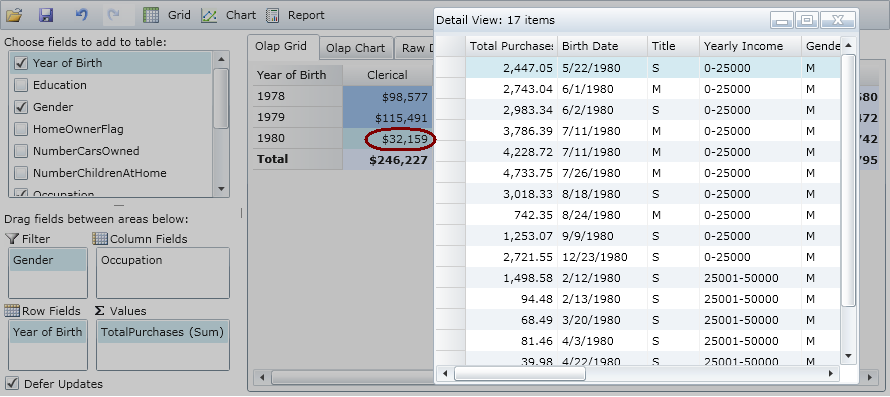
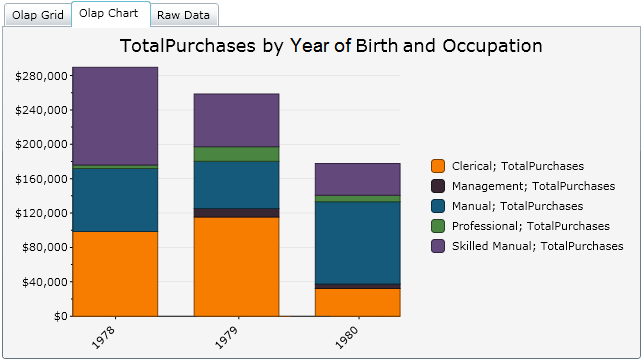
The zip file ftp://publicfiles.componentone.com/C1StudioforSharePointDataSources.zip that contains the Demographics list also contains an .olapx file named C1OlapQuickStart.olapx. Save this file when you download the Demographics data.
You can check your work by adding a C1Olap Web Part to a page, pointing to the Demographics data source in the On-Board Designer, then clicking the Open button on the C1Olap Toolbar and opening this .olapx file. Compare your Grid and Chart with the view in this file. (See Saving Your Grid and Chart for information about opening .olapx files.)