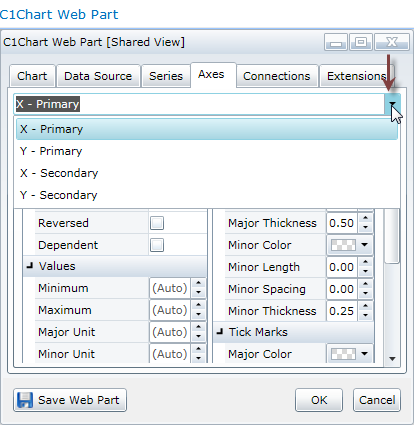
- Title = This name will be displayed for the axis. (If you leave it blank, there will be no title.)
- Angle = Places the axis annotation labels at an angle of your choice.
- Numeric Format = Specifies the formatting for numbers that are axis labels. Choose Currency to specify U.S. Dollars format. Other options are: Exponential, Fixed-Point, General, Numeric, and Percent. For more on other standard numeric formats, see http://msdn.microsoft.com/en-us/library/dwhawy9k.aspx
- Date/Time Format = Specifies the formatting for date/time labels. Options include Short Date, Long Date, Month Day, etc. For more on standard date/time formats, see: http://msdn.microsoft.com/en-us/library/az4se3k1(VS.71).aspx
Axis Properties section:
- Position = The position of the axis title (choose Default, Near, Far, OverData, or DisableLastLabelOverFlow)OverData will place the axis title over the plot elements. DisableLastLabelOverFlow will hide the last label on the axis if it exceeds the available area.
-
Reversed = Selecting this check box will reverse the order of the tick marks on the axis.
Values section:
- Minimum/Maximum = Sets the minimum and maximum values that will be displayed on the axis. (Instead of all the values in the data source.)
- Major Unit/Minor Unit = Sets the spacing between the major and minor tick marks.
- Origin = This is where the X and Y axes cross. By default, they cross at zero, but you can change that here.
- Scale = Use this field to scale down or enlarge the size of the data displayed in the chart.
Annotations section:
- Position = The position of the annotations on each axis (choose Default, Near or Far).
-
Allow Overlap = If not checked (the default), annotations will not overlap each other, and their display will vary based on the dimensions of the web part, the length of the annotation, and the axis property settings. This setting applies to the X axes only.
Grid Lines and Tick Marks sections:
- If you would like to change the default display of axis grid lines and tick marks, use the Grid Lines and Tick Marks sections.