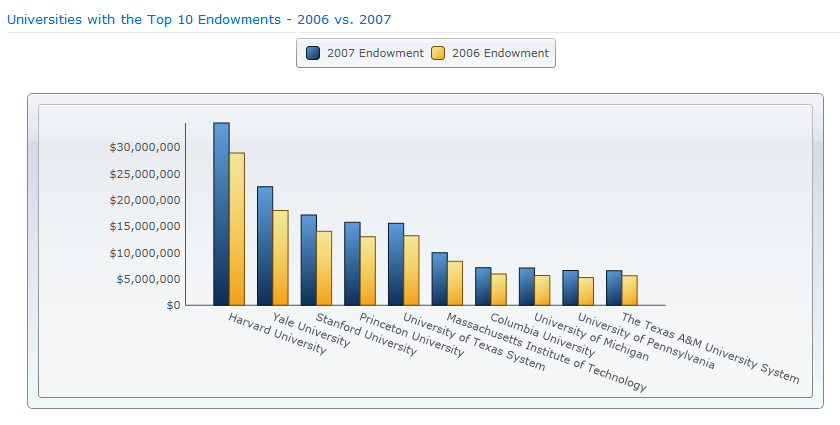
With the C1Chart Web Part, you can create charts based on SharePoint Lists or Business Connectivity Service (BCS) data in minutes. Choose from 30+ chart types (including financial charts), apply a theme, select a data source, set options, and get charts that fit into your site perfectly. Useful features include data aggregation, mixed chart types, multiple series axes, and zoom.
For more on BCS, see the Microsoft Business Connectivity Services website.

If you'd like your chart to be more exciting than plain old beige, try changing the Theme or the Palette. The C1Chart Web Part has 12 themes and 23 palettes. See Customizing the Look of Your Chart.
If you would like to connect your C1Chart Web Part to another web part on the same page, see Connecting Web Parts.