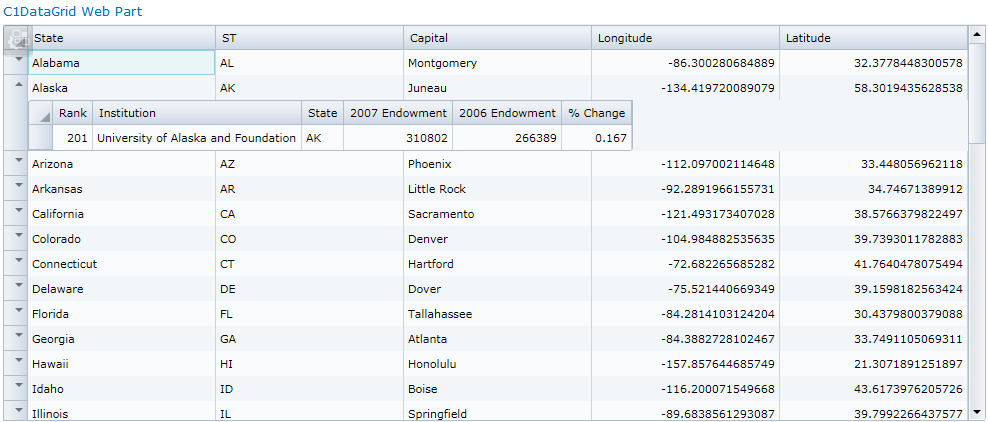
The C1DataGrid Web Part Quick Start shows you how to create an interactive grid that displays the US States and their Capitals, along with their longitude and latitude. This list can be sorted and filtered as desired. University Endowments are added to the mix to show the power of master-detail relationships in C1DataGrid.

This Quick Start uses the State Capitals and Endowments list. If you have not created these lists, see Quick Start for instructions.
How it works:
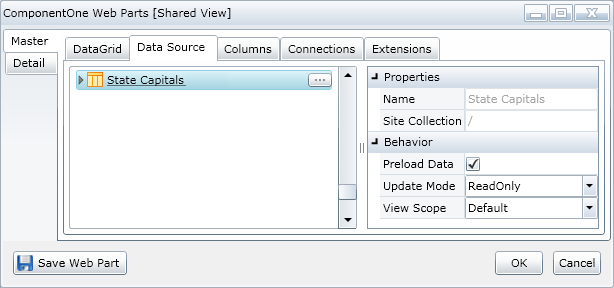
The State Capitals List contains the State names, abbreviations (the ST column), Capitals, Longitude, and Latitude.
The Endowments List contains the names (the Institution column), state, 2007 and 2006 endowments, and endowment ranking of 785 universities. It also contains the percentage change in endowments for each between 2006 and 2007.
This Quick Start combines all the data from both of these lists.
To create an interactive Data Grid

This is all you need to display the data set, which includes the name of each State, its Capital, Longitude, Latitude, and Abbreviation (the ST field in the list). You can scroll, sort, filter, and group the grid.
|
Rearrange Columns by drag and drop
Choose any column header and drag it where you would prefer. |
Scroll
|
Sort
Click the arrow at the top of each column to sort by that column. |
|
Filter
Click on the column drop-down to open filtering. Choose "Starts with", then enter "R" in the second field and click Filter to display all the states that begin with the letter R in the grid. |
Group
To enable grouping, open the On-Board Designer and click on the DataGrid tab. Select the Allow Grouping check box. | |
Several of these grid behaviors can be turned off. See Customizing the Behavior and Display of Your Grid.
To create a nested table (Master-Detail relationship)
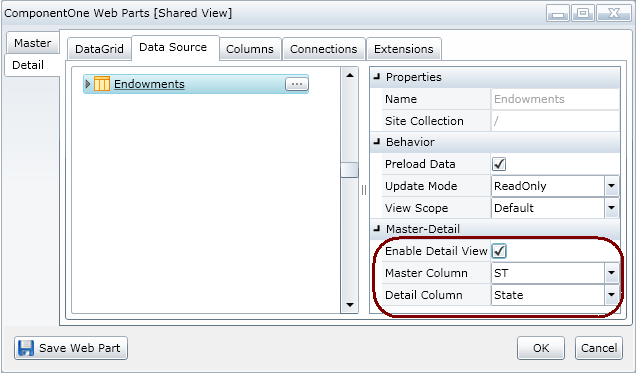
We can add information from the Endowments List to our existing chart and create a chart that displays both sets of data, related in a logical way.

Choosing Enable Detail View turns on the nesting. The Master Column of ST is pulled from the State Capitals List and the Detail Column of State is pulled from the Endowments List.
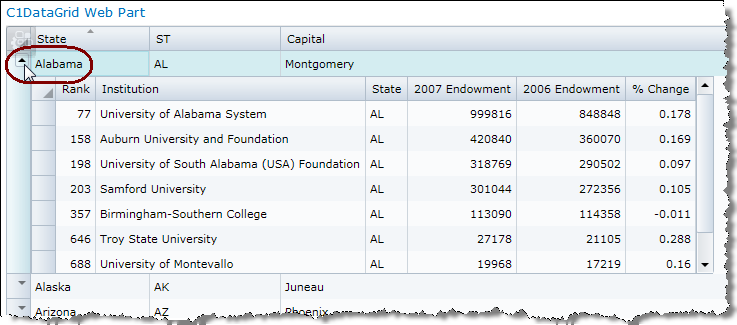
Now your grid will display an arrow next to each State. Click on it, and you will see the Endowment information for every University in that State. When you close the Endowment information, the State Capitals information is still the "Master" view.

You can clear or hide columns in either data source if you wish, see Selecting the Data to Display.